Data Engine: Health and Safety
- Data Engine H&S: H&S Introduction
- Data Engine H&S: H&S Beginner's Guide
- Data Engine H&S: Live H&S
- Data Engine H&S: H&S Trends
Data Engine H&S: H&S Introduction
DataEngine: H&S is a module designed to combine three essential safety analytics solutions, including PPE Detection, Slip and Fall Detection, and Hazardous Area Detection.
- PPE Detection uses AI-powered analytics to automatically identify missing or incorrectly worn personal protective equipment (PPE), including hard hats and hi-vis vests.
- Slip and Fall Detection recognises slips, trips, and falls in real time, logging incidents with supporting evidence for analysis and reporting.
- Hazardous Area Detection creates virtual boundaries around restricted or high-risk areas, detecting unauthorised access and unsafe positioning.
With DataEngine: H&S, organisations can improve compliance through automated audits and reporting, reduce risk and liability, and gain actionable insights to support strategic decision-making and improved safety performance.
For the beginner's guide, see Data Engine H&S: H&S Beginner's Guide.
Complete 24 Aug 2026
Data Engine H&S: H&S Beginner's Guide
Introduction
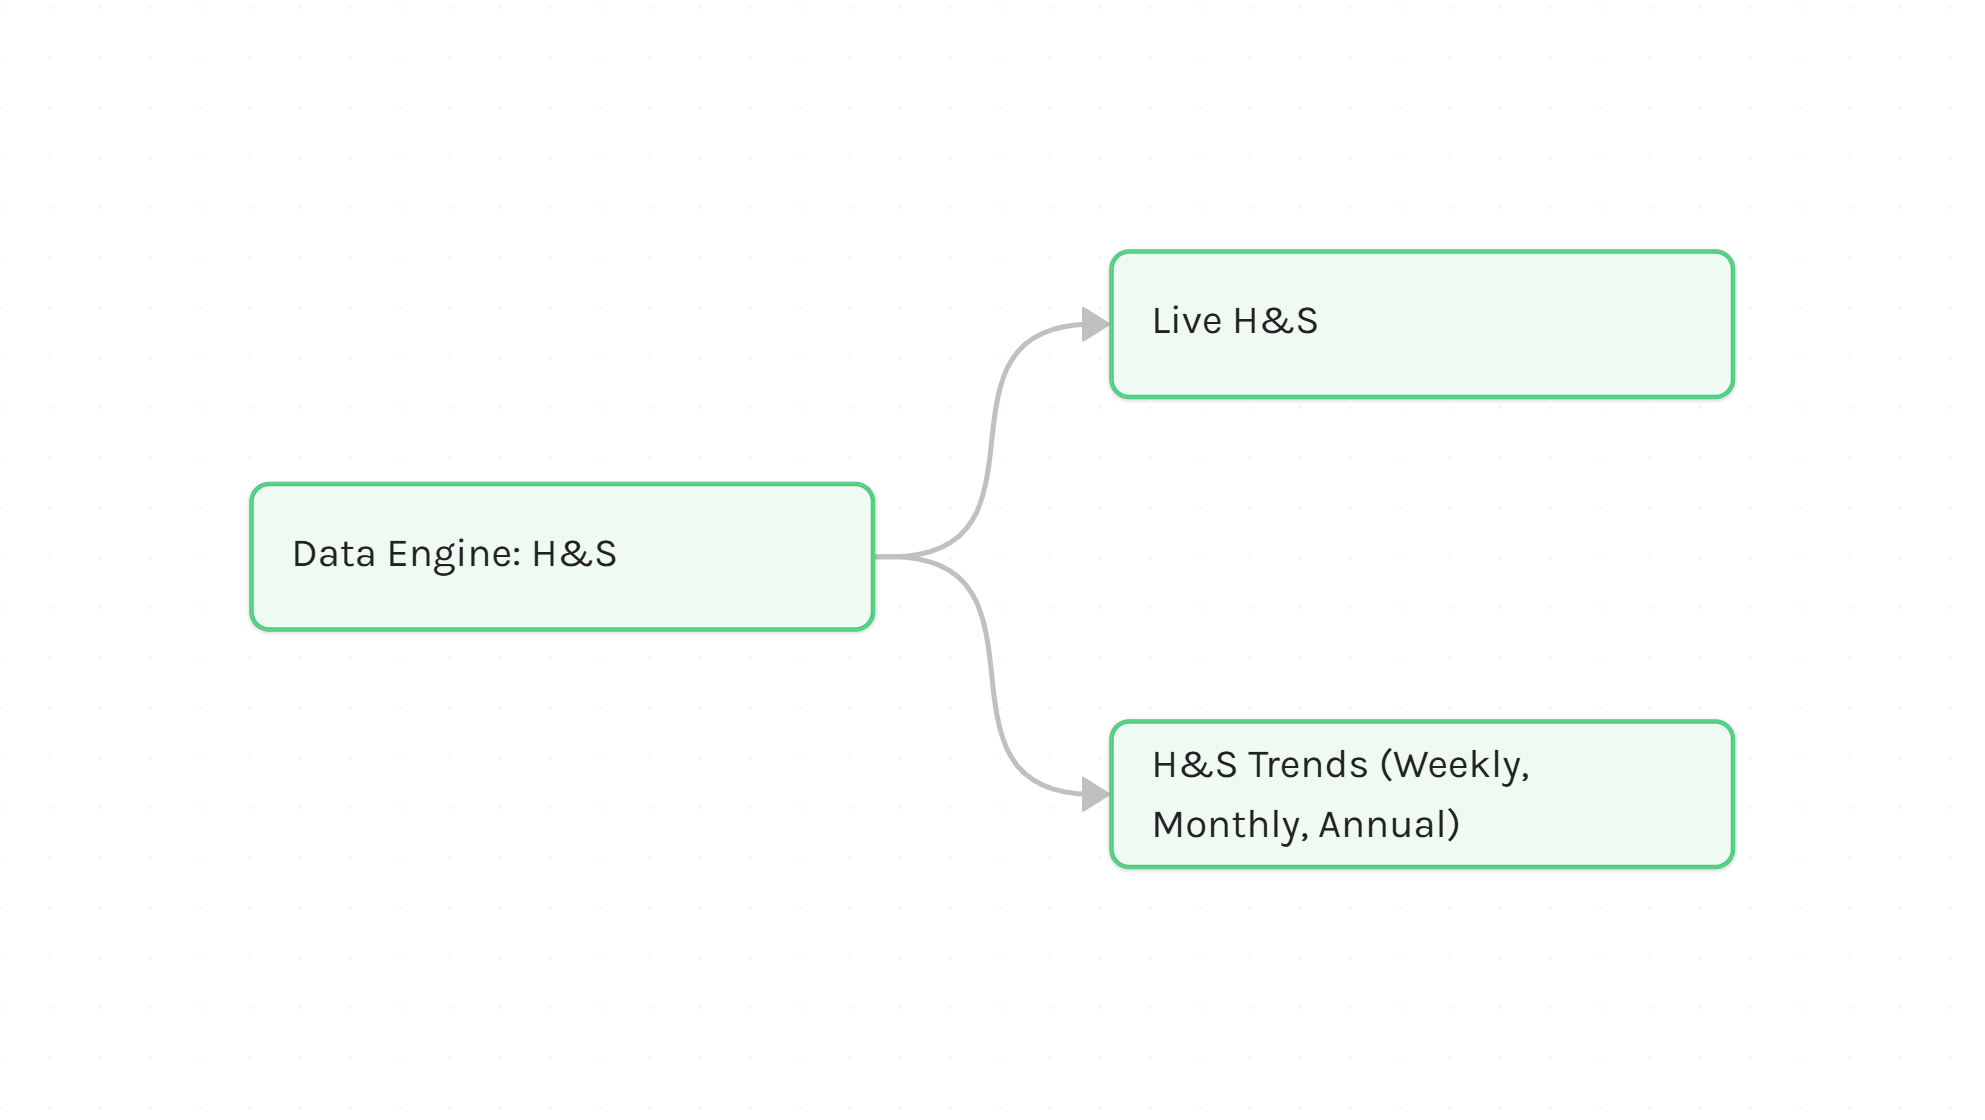
In the H&S module, there are 2 different tabs: Live H&S and H&S Trends.
- Live H&S offers an interactive interface providing access to alarms, trends, and visualisations.
- H&S Trends offers an analytical interface providing access to comprehensive analytics, trends, and patterns.
Live H&S
Dataengine H&S: Live H&S is the primary interface available within the H&S module, providing access to filters, trends, visualisations, compliance versus non-compliance metrics, and recent events.
In Short: Access critical H&S insights, including rule-based alarms, recent events, PPE compliance and non-compliance, trends, and visualisations.
For more information, see Data Engine H&S: Live H&S.
H&S Trends
H&S Trends and its components provide an aggregated anaylsis of historical data across site and time periods, delivering high-level insight into trends, patterns, and performance over-time.
In Short: Access detailed analysis of weekly, monthly, and annual H&S trends through a variety of visualisations.
For more information, see Data Engine H&S: H&S Trends
Complete 24 Aug 2026
Data Engine H&S: Live H&S
Introduction
Dataengine H&S: Live H&S is the primary interface available within the H&S module, providing access to filters, trends, visualisations, compliance versus non-compliance metrics, and recent events.
This supports administrators to compare compliance and non-compliance events using a range of visualisations, helping to identify patterns, distributions, and trends over time.
Visualisations
Dataengine H&S: Live H&S has a variety of visualisations accessible to users to help understand trends over different time periods, which can be defined using the filters. Primarily, the visualisations highlight PPE Compliance vs PPE Non Compliance.
Additional visualisations can be created via DE Config: Rule and DE Config: Rule Category such as Road Sign Compliance.
- PPE Compliance refers to a user that is detected wearing appropriate PPE.
- PPE Non Compliance refers to a user that is detected not wearing appropriate PPE.
Events
Events display the alerts generated by the analytics server, allowing users to analyse the output of the configured analytics. Primarily, the events have their own metadata and priority levels. Clicking on an event opens a side pane containing the associated video, image, and additional event information.
Complete 24 Aug 2026
Data Engine H&S: H&S Trends
Introduction
Data Engine H&S: H&S Trends are built on the same framework as Footfall Trends, but have their own charts and filtering options. They provide a more detailed and comprehensive analysis than the visualisations available in Dataengine H&S: Live H&S.
H&S Trends and its components provide an aggregated anaylsis of historical data across site and time periods, delivering high-level insight into trends, patterns, and performance over-time.
H&S Trends are structured into three components:
- Weekly Trends: Review a week's performance and compare the current week's data against historical periods, such as the previous week and the same week in previous years, to identify short- to medium-term trends and patterns.
- Monthly Trends: Review a month's performance and compare the current month's data against historical periods, such as the previous month and the same month in previous years, to identify medium-term trends and seasonal patterns.
- Annual Trends: Review a year's performance and compare the current year's data against historical periods, such as previous years, to identify long-term trends, growth patterns, and performance changes over time.
Filtering
There are a variety of filters available in H&S Trends, including:
- Filter by site,
- Filter by year, month, or week,
- Filter by rule,
- Filter by camera,
- Filter by category.
Enabling users to analyse historical data (e.g., 2026 July for Location 1) as seamlessly as the current week.
Alongside the filters, users are presented with at-a-glance-metrics such as week-over-week change or previous month's total to provide a baseline snapshot of performance.
Visualisations
H&S Trends provides a range of visualiations suited to each retrospective time period, helping users to:
- Compare compliance vs non-compliance trends.
- Understand the distribution of compliance and non-compliance.
- Identify areas of non-compliance by location.
- Analyse trends over different time periods.
- Identify changes in compliance performance over time.
- Review peak periods of non-compliance.
- Compare performance across a different site or zone.
- Understand recurring compliance issues and patterns.
Complete 24 Aug 2026