Data Engine: People Counting
- People Counting: Introduction
- People Counting: Beginner's Guide
- People Counting: Components
- People Counting: Occupancy Overview
- People Counting: Occupancy Details
- People Counting: Live Dashboard
- People Counting: Footfall Trends
- People Counting: What Is a Zone?
People Counting: Introduction
Dataengine: People Counting is a solution designed to enhance how business track and analyse foot traffic (or footfall.) Utilising video analytics, Dataengine: People Counting can detect and count people within defined areas, providing visibility into occupancy.
This can be utilised to analyse room utilisation, traffic patterns, peak hours to support informed decision-making. Paired with over-capacity, a derivative of occupancy, enabling the identification of overcrowding and providing alerts when a space exceeds capacity.
For the beginner's guide, see People Counting: Beginner's Guide.
Complete 24 Aug 2026
People Counting: Beginner's Guide
Introduction
In the Data Engine: People Counting, there are 3 different tabs:
- Occupancy Overview,
- Occupancy Details,
- Footfall Trends.
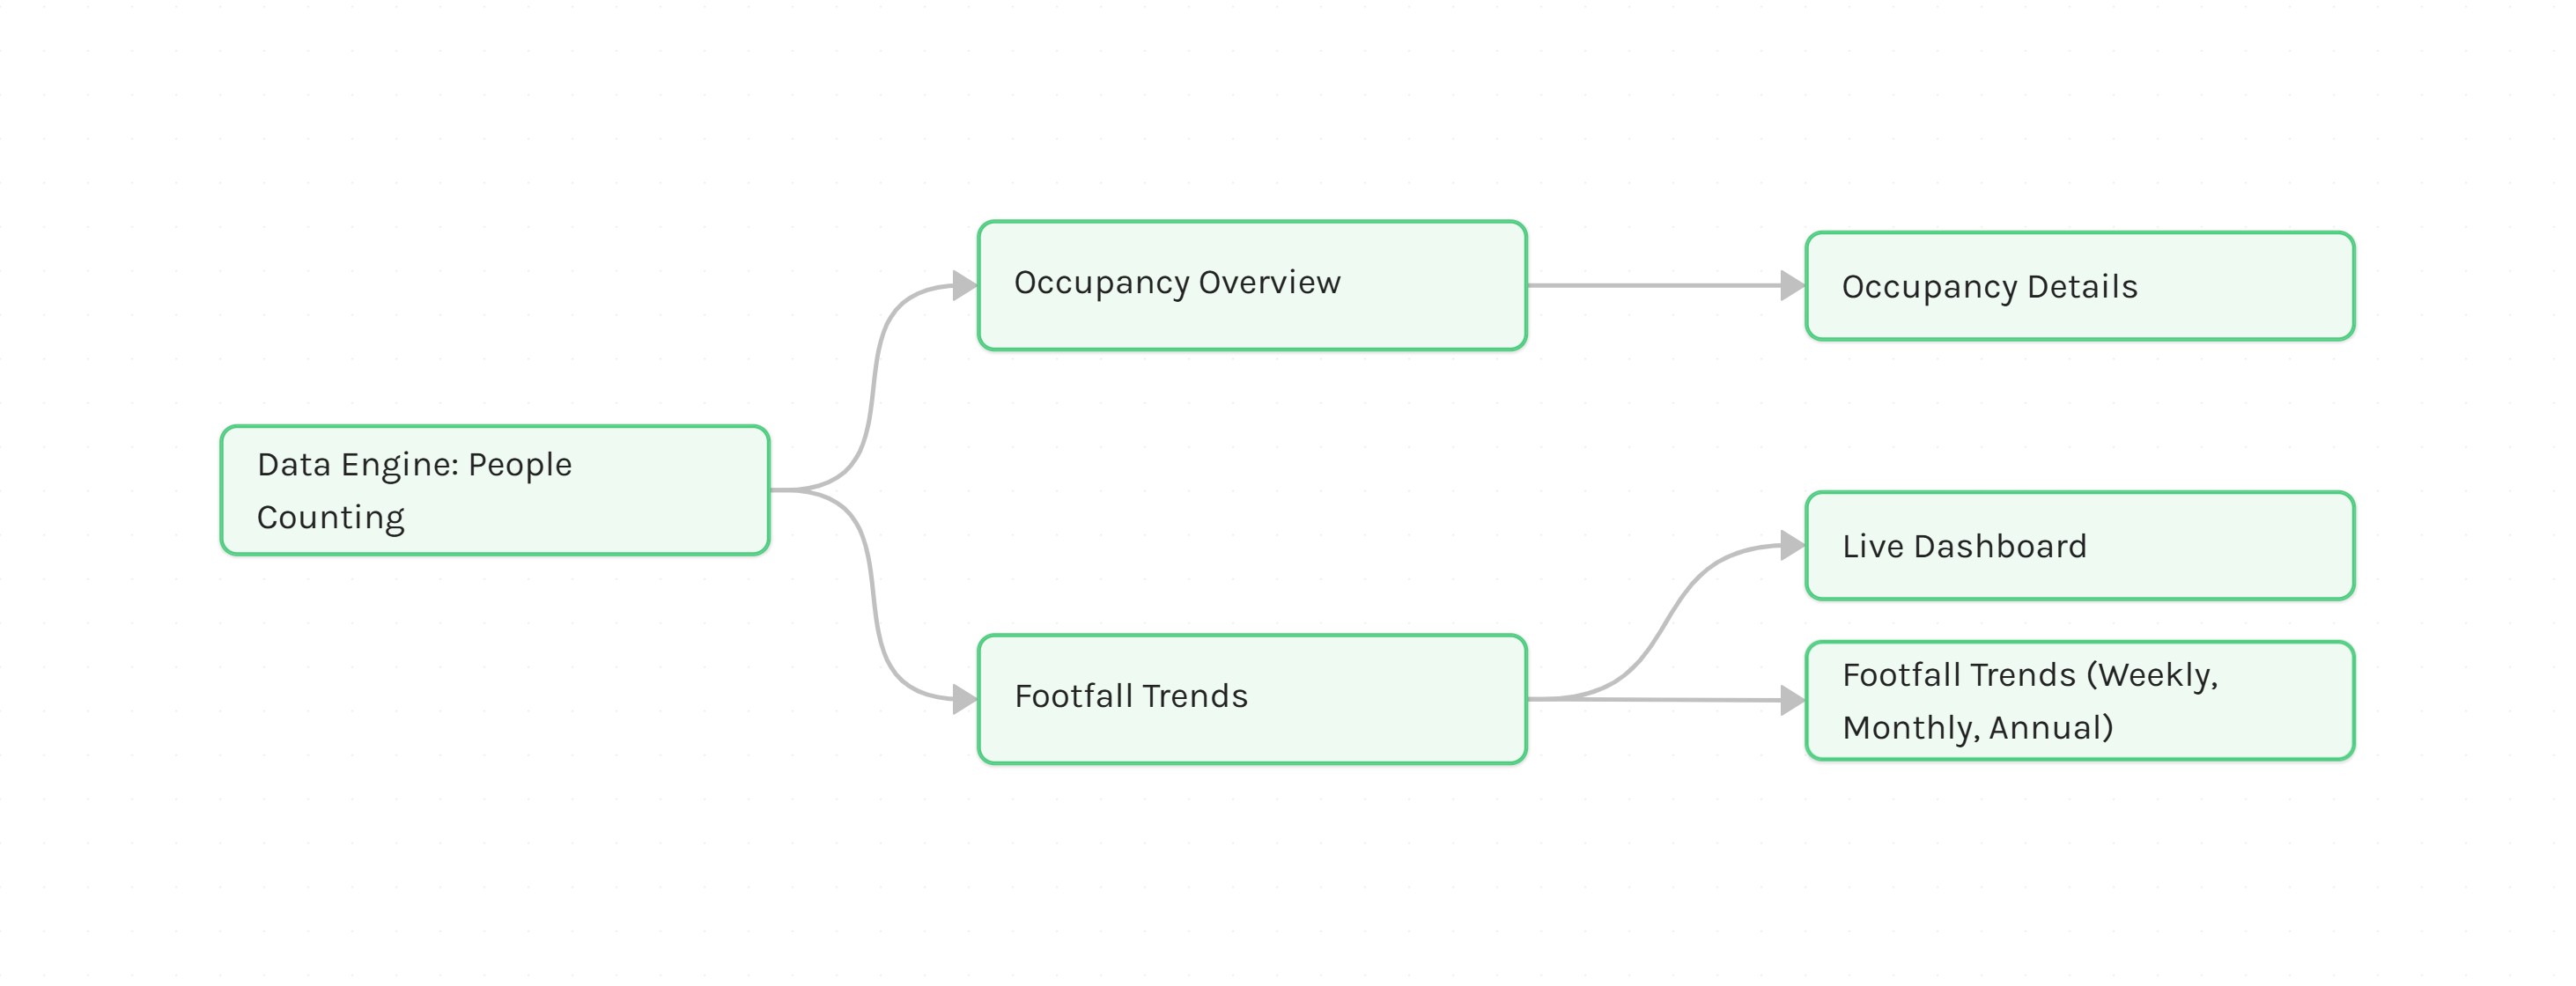
Occupancy Overview
Occupancy Overview provides visibility into overcapacity incidents, occupancy trends, and key metrics such as average occupancy, total occupancy, and hourly occupancy breakdown across a zone.
For more information, see People Counting: Occupancy Overview
Occupancy Details
Occupancy Details is nested inside Occupancy Overview and provides detailed analysis of an individual zone.
To access Occupancy Details, click on a zone.
For more information, see People Counting: Occupancy Details
Footfall Trends
Footfall Trends and its components provide an aggregated anaylsis of historical data across site and time periods, delivering high-level insight into trends, patterns, and performance over-time.
A variety of footfall trends are available:
- Live Dashboard,
- Weekly Footfall Trends,
- Monthly Footfall Trends,
- Annual Footfall Trends.
Each option provides a different level of aggregation, from real-time analytics through to long-term trends (weekly, monthly, and yearly).
The Live Dashboard is useful for real-time monitoring, while Weekly and Monthly Trends are typically the most useful starting points for analysing patterns over time. Annual Trends are best suited for long-term comparisons.
There are a variety of filters available in Footfall Trends, including:
- Filter by site.
- Filter by year, month, or week
Enabling users to analyse historical data (e.g., 2023 Week 18 for Location 1) as seamlessly as the current week.
For more information, see People Counting: Footfall Trends.
Complete 18 Aug 2026
People Counting: Components
People Counting: Occupancy Overview
Introduction
Occupancy Overview provides visibility into overcapacity incidents, occupancy trends, and key metrics such as average occupancy, total occupancy, and hourly occupancy breakdown across a zone.
Clicking a zone opens People Counting: Occupancy Details, providing detailed occupancy information.
Metrics & Charts
Metrics and charts available to users include:
- Live Occupancy,
- Occupancy Settings,
- Arrival & Departure Locations,
- Occupancy Trend,
- Over-Capacity Incidents,
- Hourly Breakdown
These metrics and charts help organisations visualise organisation-wide occupancy, including occupancy trends, over-capacity incidents, and the busiest arrival or departure locations to support auditing and operational awareness.
Complete 18 Aug 2026
People Counting: Occupancy Details
Introduction
Occupancy Details is nested inside of People Counting: Occupancy Overview and provides detailed analysis of an individual zone.
Metrics & Charts
Metrics and charts available to users include:
- Minimum, Maximum, and Average Occupancy,
- Capacity Limits,
- Occupancy Trends,
- Peak Hours,
- Off-Peak Hours,
- Location Breakdown,
- Over-Capacity Incidents,
These metrics and charts help organisations identify occupancy trends and patterns, detect peak and off-peak periods, while supporting auditing and improving occupany awareness.
Complete 18 Aug 2026
People Counting: Live Dashboard
Introduction
Live Dashboard provides footfall analytics, including key metrics and detailed breakdowns, enabling users to analyse footfall information in real-time.
Metrics & Charts
There are various metrics and charts available, such as:
- Occupancy,
- Arrivals,
- Departures,
- Net Difference (difference between arrivals and departures),
- Footfall Trends,
- Footfall Trends Hourly Log,
- Zones in Use,
- Zones Comparison,
These metrics and charts help users identify the most critical live information, all in one place.
Complete 18 Aug 2026
People Counting: Footfall Trends
Introduction
Footfall Trends and its components provide an aggregated anaylsis of historical data across site and time periods, delivering high-level insight into trends, patterns, and performance over-time.
Footfall Trends are structured into three components:
- Weekly Trends: Compare the current week's data against historical periods, such as the previous week and the same week in previous years, to identify short- to medium-term trends and patterns.
- Monthly Trends : Compare the current month's data against historical periods, such as the previous month and the same month in previous years, to identify medium-term trends and seasonal patterns.
- Annual Trends: Compare the current year's data against historical periods, such as previous years, to identify long-term trends, growth patterns, and performance changes over time.
Filtering
There are a variety of filters available in Footfall Trends, including:
- Filter by site.
- Filter by year, month, or week
Enabling users to analyse historical data (e.g., 2023 Week 18 for Location 1) as seamlessly as the current week.
Alongside the filters, users are presented with at-a-glance-metrics such as week-over-week change or previous month's total to provide a baseline snapshot of performance.
Visualisations
Footfall Trends provides a range of visualisations across different retrospective time periods, helping users:
- Track footfall trends over time.
- Identify peak and off-peak traffic periods.
- Percieve unusual increases or decreases in activity.
- Compare year-over-year performance.
- Identify busy locations to support business decision-making.
- Compare footfall by site.
Complete 18 Aug 2026
People Counting: What Is a Zone?
A zone in DataEngine is exclusively associated with Data Engine: People Counting and represents a monitored area within a site. A zone is associated with one or more people-counting sensors.
There can be multiple arrival and departure points within a zone. For instance, a site could have a technical office and a creative office, each with its own occupancy data.
For more information on zone configuration, see Data Engine Administation: Zone Management
In conclusion, a zone represents monitored area, and the associated people-counting sensors provide occupancy data for that area.
Complete 20 Aug 2026