Data Engine H&S: H&S Trends
Data Engine H&S: Reports are built on the same framework as Footfall Trends, but have their own charts, filtering. This is a more detailed, thorough component of the visualisations available in Dataengine H&S: Live H&S.
H&S Reports and its components provide an aggregated anaylsis of historical data across site and time periods, delivering high-level insight into trends, patterns, and performance over-time.
As the Weekly, Monthly, and Annual Trends share the same structure and functionality, only the Monthly guide has been provisioned.
H&S Reports are structured into three components:
- Weekly Trends: Review a week's performance and compare the current week's data against historical periods, such as the previous week and the same week in previous years, to identify short- to medium-term trends and patterns.
- Monthly Trends: Review a month's performance and compare the current month's data against historical periods, such as the previous month and the same month in previous years, to identify medium-term trends and seasonal patterns.
- Annual Trends: Review a year's performance and compare the current year's data against historical periods, such as previous years, to identify long-term trends, growth patterns, and performance changes over time.
Filtering
There are a variety of filters available in Footfall Trends, including:
- Filter by site,
- Filter by year, month, or week,
- Filter by rule,
- Filter by camera,
- Filter by category,
Enabling users to analyse historical data (e.g., 2026 July for Location 1) as seamlessly as the current week.
Alongside the filters, users are presented with at-a-glance-metrics such as week-over-week change or previous month's total to provide a baseline snapshot of performance.
Visualisations
H&S Reports provides a range of visualiations suited to each retrospective time period, helping users to:
- Compare compliance vs non-compliance trends.
- Understand the distribution of compliance and non-compliance.
- Identify areas of non-compliance by location.
- Analyse trends over different time periods.
- Identify changes in compliance performance over time.
- Review peak periods of non-compliance.
- Compare performance across different sites or zones.
- Understand recurring compliance issues and patterns.
and more...
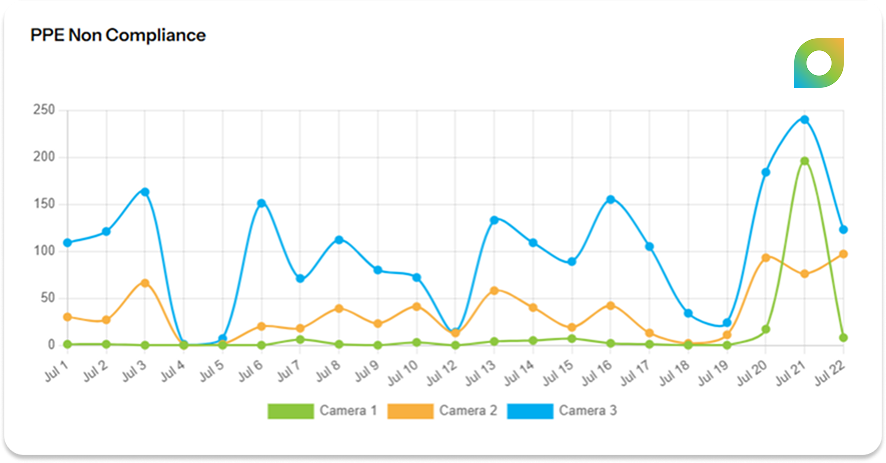
Example of PPE Non Compliance by Camera
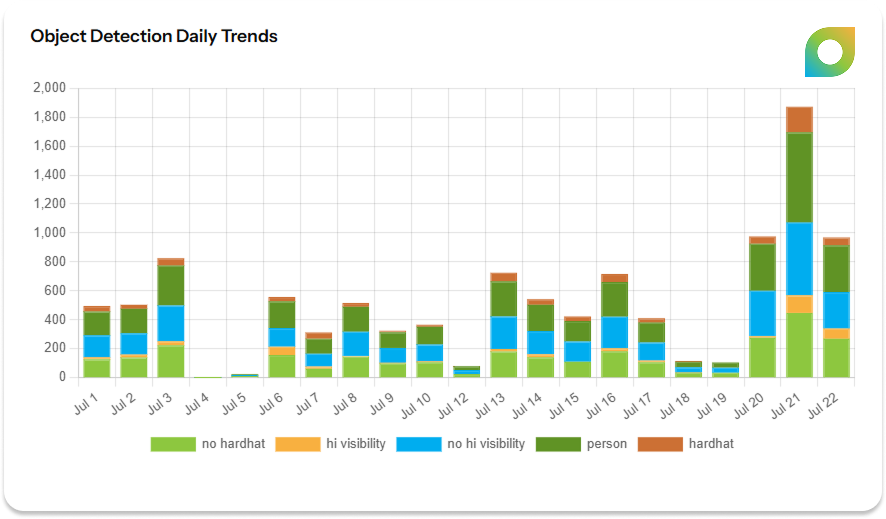
Example of Object Detection Distribution Daily Trends