People Counting: Quickstart Guide 🚀︎
In the People Counting module, there are 3 different tabs: People Counting Events, Occupancy Overview, and Footfall Reports.

- People Counting Events provide detailed insights into event activity, including alarms, trends, density, total counts, and recent events, alongside video and image footage for visual verification.
- Occupancy Overview provides real-time and historical insights into zone usage, including occupancy trends, over-capacity incidents, and detailed analytics to help understand footfall patterns.
- Footfall Reports provide detailed analytics and trends across real-time, weekly, monthly, and annual periods.
People Counting Events
In People Counting Events, the primary customisation options are available through the filters, allowing users to filter by site, camera, server type, created rules, and timeframe. At the top of the the screen, users can also view count statistics such as total count for the timeframe.


At the bottom users can view recent events. Clicking an event opens an enlarged side panel that displays alert details, associated video footage, or server information. Users can also download the video, image, or both as evidence.
Occupancy Overview
The Occupancy Overview provides real-time zone monitoring, including overcapacity incidents and overall information, as well as daily hisotical data.
To view more detailed information about a specific zone, such as the Bi3 Experience Centre,Location, select the relevant zone.


This detailed view allows a specific time period to be selected, including the last hour, day, week, or month. Information for the selected zone is displayed, including over-occupancy incidents, peak occupancy periods, and low-occupancy periods. For example, at Bi3, low occupancy is expected outside normal operating hours, such as after 9:00 PM.


FootFallFootfall Reports
A variety of Footfall reporting options are available:
- Live Footfall Dashboard
- Weekly Footfall Trends
- Monthly Footfall Trends
- Annual Footfall Trends
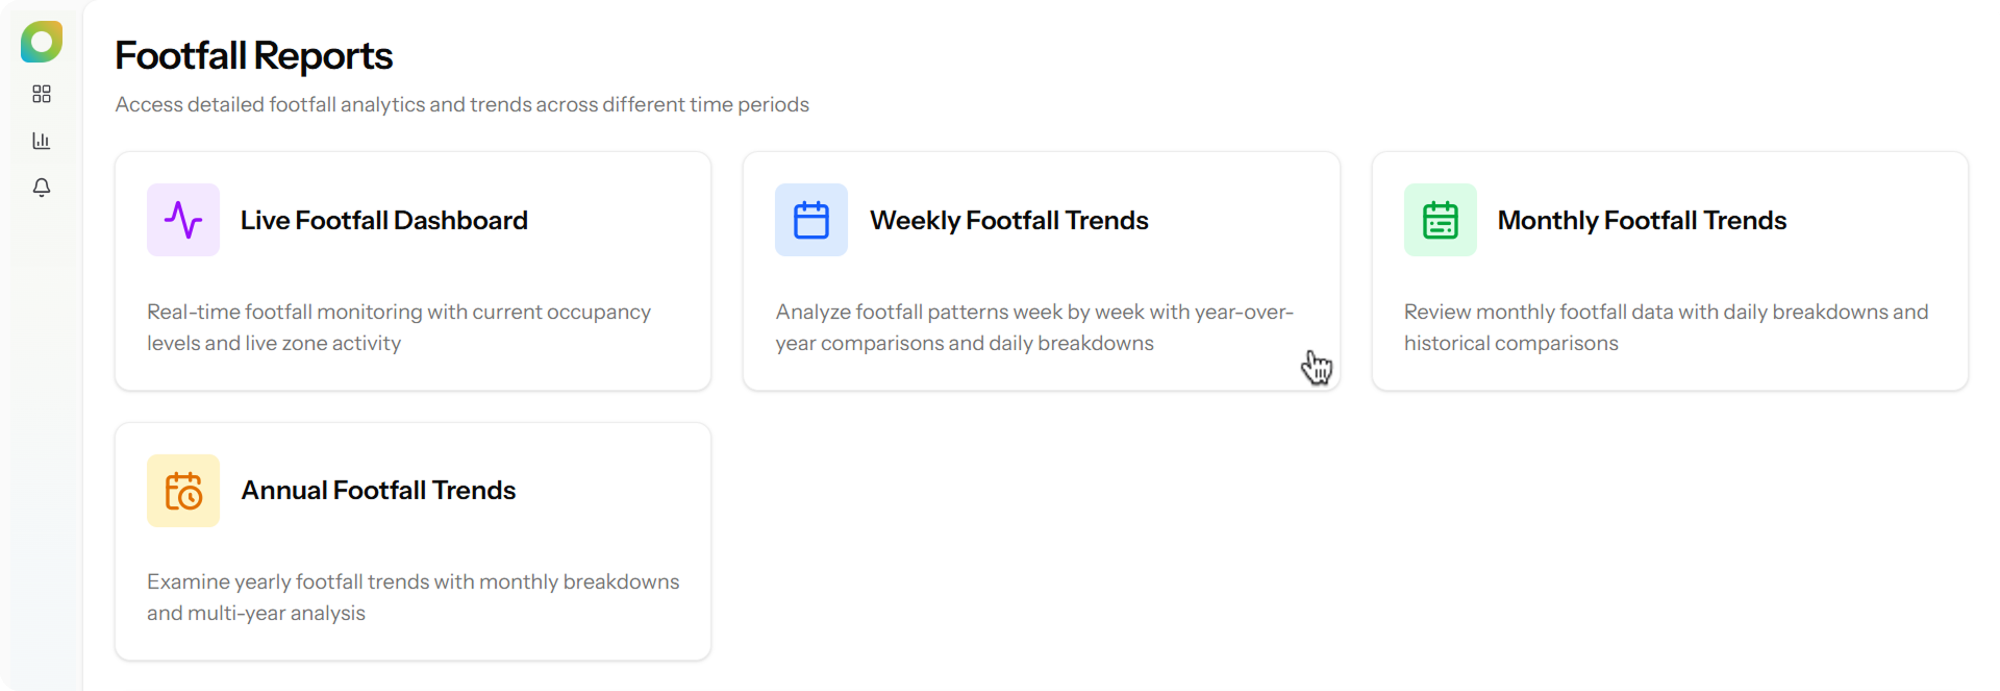
Each option provides a different level of aggregation, from real-time analytics through to long-term trends (weekly, monthly, and yearly).
The Live Dashboard is useful for real-time monitoring, while weekly and monthly reports are typically the most useful starting points for analysing patterns over time. Annual trends are best suited for long-term comparisons.
As an example, we will use the Weekly Footfall Trends for Week 1725 of 2026, since the dashboards share a similar structure.
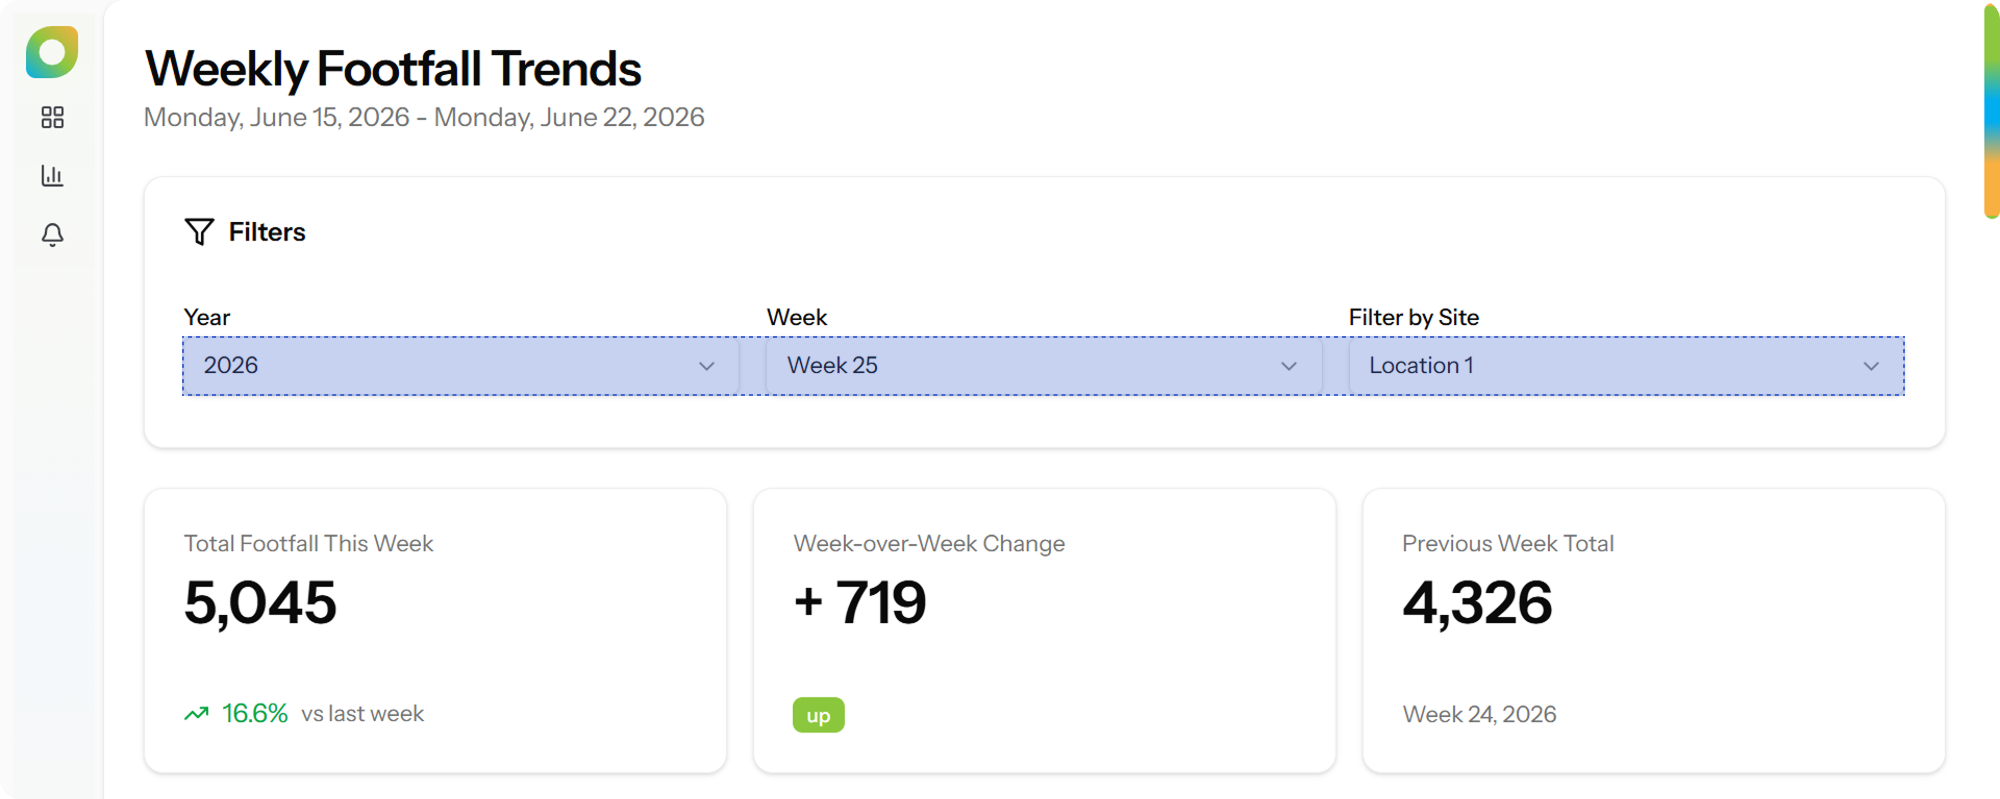
When opening the Weekly Footfall Trends, we are presented with some filters, including year, week, and site. After selecting the filters, a range of charts become available, such as daily footfall breakdown and average hourly footfall paterns, among others.