
People Counting: Beginner's Guide
Introduction
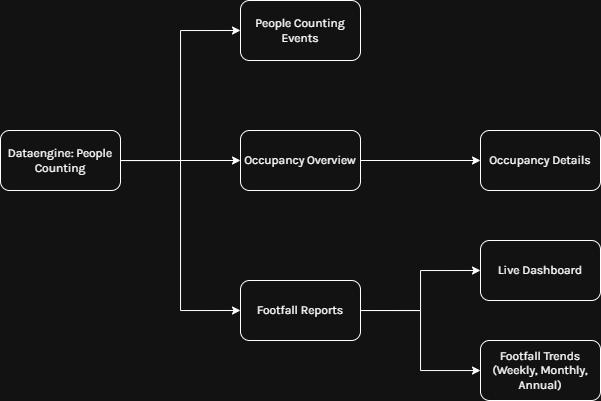
In the Data Engine: People Counting, there are 4 different tabs:
- Events,
- Occupancy Overview,
- Occupancy Details,
- Footfall Reports.
People Counting Events
People Counting Events provides an organisation-wide overview of people counting activity, giving users visibility into events, trends, and key activity across sites.
Occupancy Overview & Occupancy Details
Occupancy Overview provides visibility into overcapacity incidents, occupancy trends, and key metrics in real-time such as average occupancy, total occupancy, and hourly occupancy breakdown across a zone.
For more information, see People Counting: Occupancy Overview
Occupancy Details is nested inside of Occupancy Overview and provides detailed analysis of an individual zone. To access Occupancy Details, click on a zone.
For more information, see People Counting: Occupancy Details
Footfall Trends
Footfall Trends and its components provide an aggregated anaylsis of historical data across site and time periods, delivering high-level insight into trends, patterns, and performance over-time.
A variety of footfall trends are available:
- Live Dashboard,
- Weekly Footfall Trends,
- Monthly Footfall Trends,
- Annual Footfall Trends.
Each option provides a different level of aggregation, from real-time analytics through to long-term trends (weekly, monthly, and yearly).
The Live Dashboard is useful for real-time monitoring, while Weekly and Monthly Trends are typically the most useful starting points for analysing patterns over time. Annual Trends are best suited for long-term comparisons.
There are a variety of filters available in Footfall Trends, including:
- Filter by site.
- Filter by year, month, or week
Enabling users to analyse historical data (e.g., 2023 Week 18 for Location 1) as seamlessly as the current week.
For more information, see People Counting: Footfall Trends.