Dataengine: Footfall Trends
Footfall Trends provides an aggregated anaylsis of historical data across site and time periods, delivering high-level insight into trends, patterns, and performance over time.
Footfall Trends is structured into three components:
Please refer the attachments tab for the Introduction to Weekly/Monthly/Annual Footfall Trends Visual Guides.
Filtering
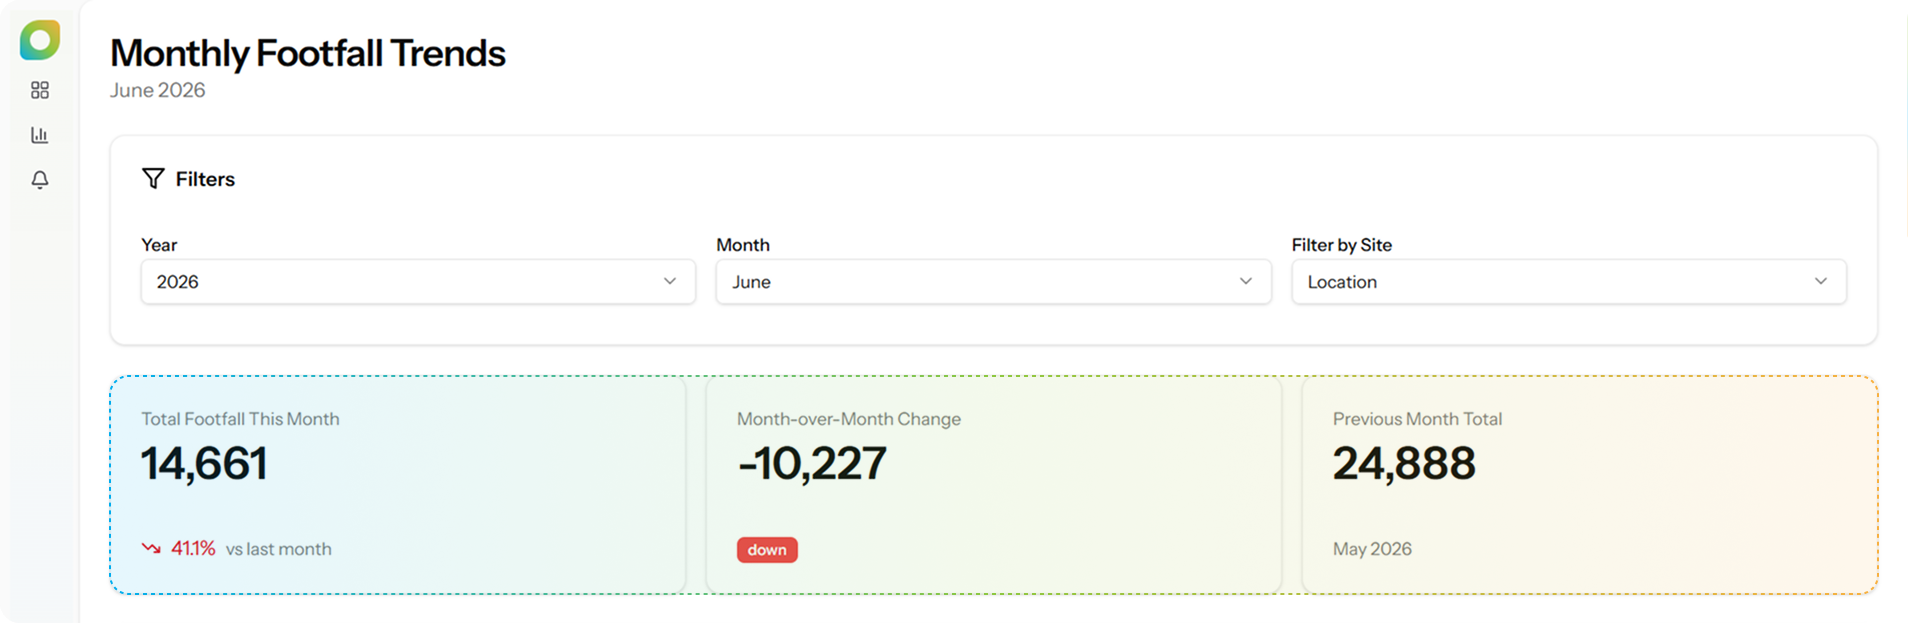
There are a variety of filters available in Footfall Trends, including:
Enabling users to analyse historical data (e.g., 2023 Week 18 for Location 1) as seamlessly as the current week.
Alongside the filters, users are presented with at-a-glance-metrics such as week-over-week or month-over-month change to provide a baseline snapshot of performance.
Example of Monthly Footfall Trends
Visualisations
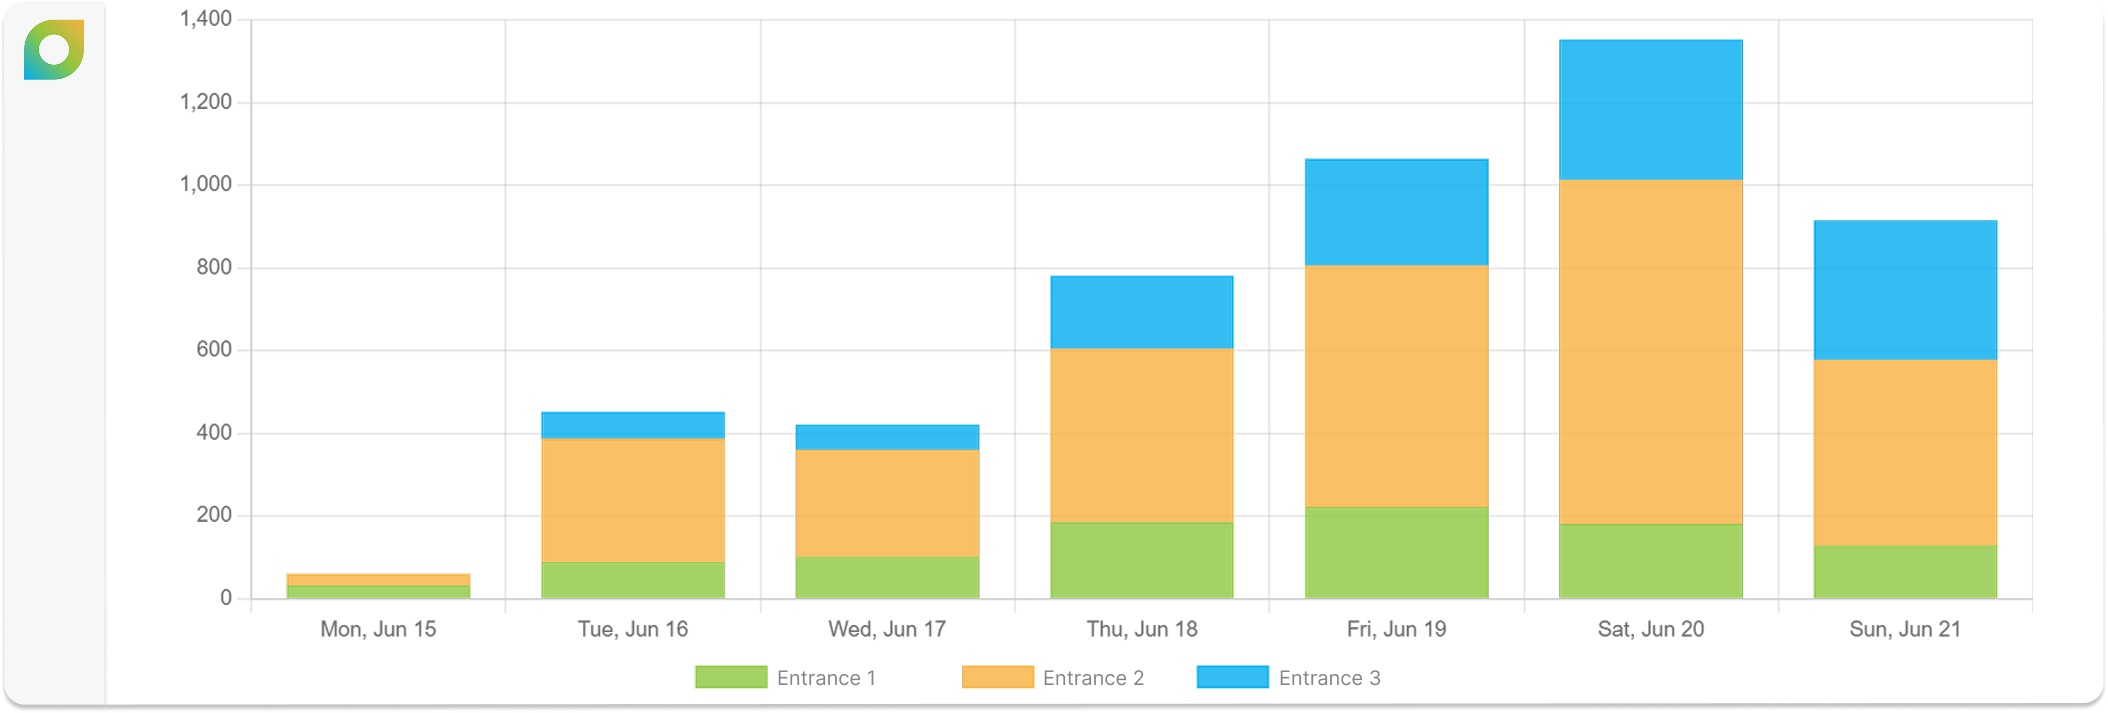
Footfall Trends provides a range of visualiations suited to their retrospective time period, however, overall the visualisations help:
and more...
Example of Daily Footfall by Location