Dataengine: Footfall Trends
Footfall Trends and its components provide an aggregated anaylsis of historical data across site and time periods, delivering high-level insight into trends, patterns, and performance over-time.
Footfall Trends are structured into three components:
- Weekly Trends: Compare the current week's data against historical periods, such as the previous week and the same week in previous years, to identify short- to medium-term trends and patterns.
- Monthly Trends : Compare the current month's data against historical periods, such as the previous month and the same month in previous years, to identify medium-term trends and seasonal patterns.
- Annual Trends: Compare the current year's data against historical periods, such as previous years, to identify long-term trends, growth patterns, and performance changes over time.
Please refer the attachments tab for the Introduction to Weekly/Monthly/Annual Footfall Trends Visual Guides.
Filtering
There are a variety of filters available in Footfall Trends, including:
- Filter by site.
- Filter by year, month, or week
Enabling users to analyse historical data (e.g., 2023 Week 18 for Location 1) as seamlessly as the current week.
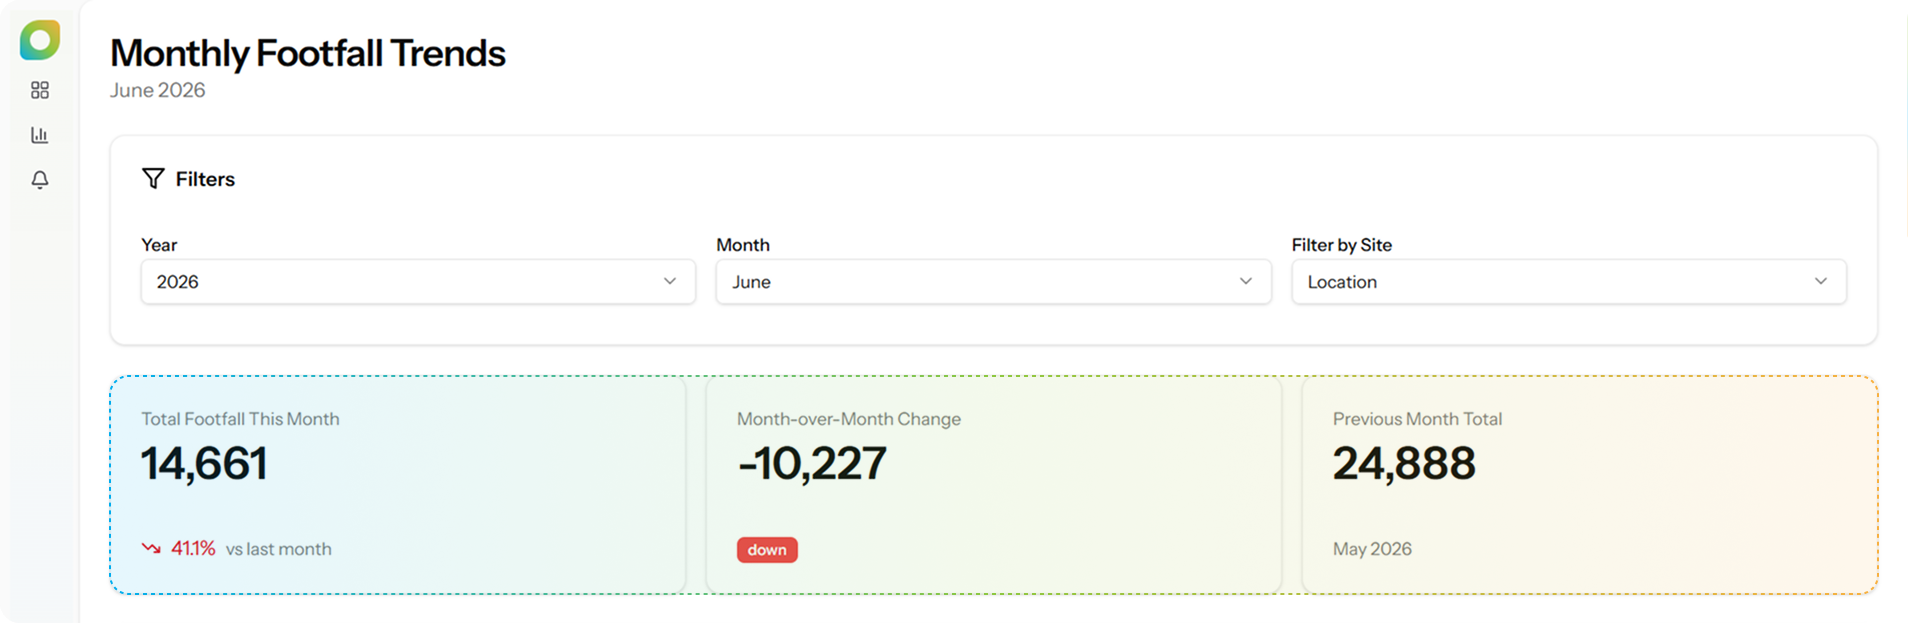
Alongside the filters, users are presented with at-a-glance-metrics such as week-over-week change or previous month's total to provide a baseline snapshot of performance.
Example of Monthly Footfall Trends
Visualisations
Footfall Trends provides a range of visualiations suited to each retrospective time period, helping users to:
- Track footfall trends over time.
- Identify peak and off-peak traffic periods.
- Spot unusual increases or decreases in activity.
- Compare year-over-year performance.
- Identify high-traffic flow points.
- Identify busy locations to support business decision-making.
- Compare footfall by site.
and more...
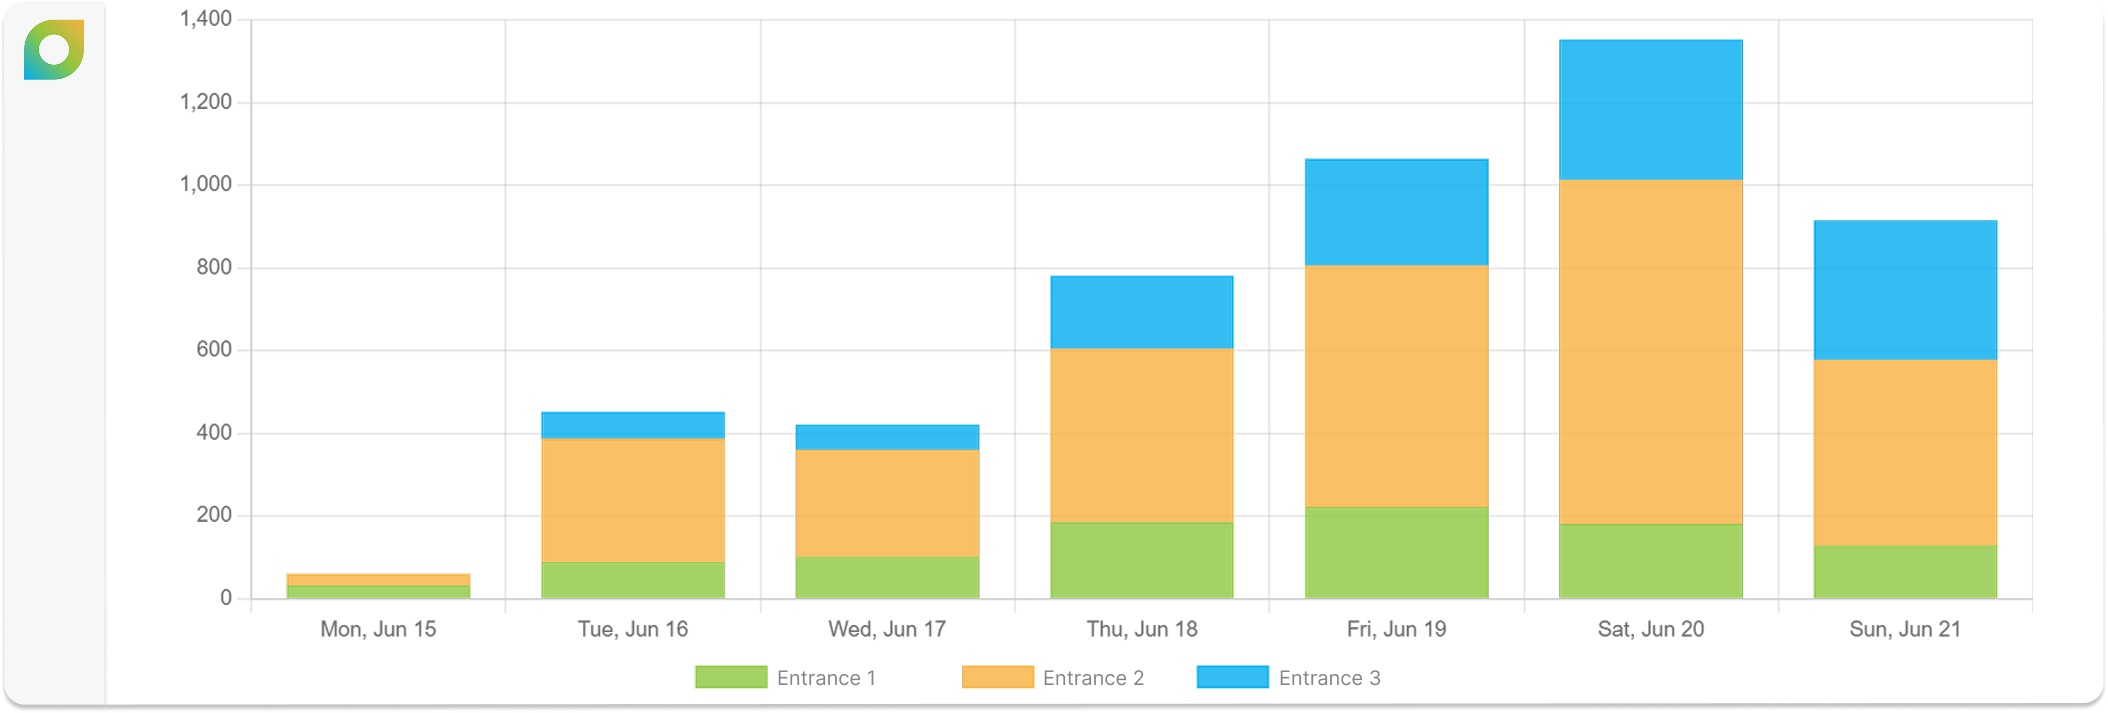
Example of Daily Footfall by Location