Dataengine: Live Dashboard
TheData Engine: Live Footfall Dashboard providesdelivers real-time footfall analytics, key metrics, and detailed breakdowns, enabling granulardetailed insightanalysis intoof footfall byacross site and zone andzone, allowing users to monitor current occupancy levels, as well as custom rules.
Please refer the attachments tab for the Introduction toThe Live Dashboard Visualserves Guideas the central hub for life footfall analytics accross the entire organisation.
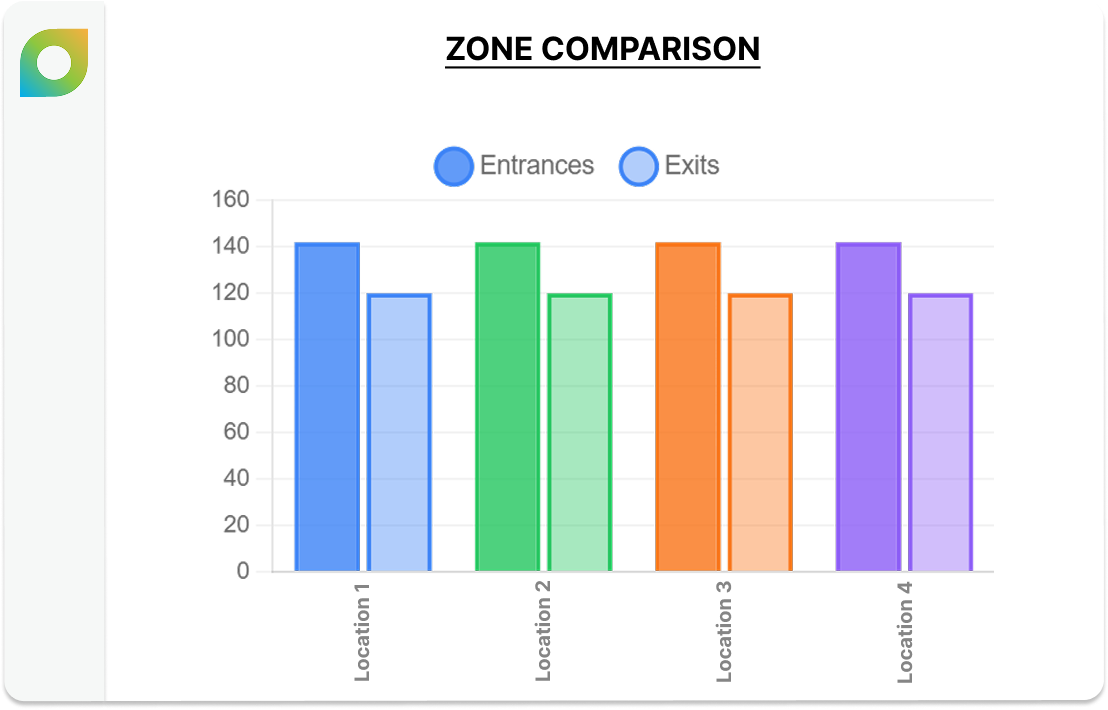
Metrics & Charts
AvailableMetrics features& include:Charts such as:
At-a-glanceCurrentmetrics.Occupancy
Comparison Detailed